Kansas voter rolls overall are in better shape than a year ago, with a recent audit showing 27,000 fewer “inactive” voters still on the rolls this January than January ’24. But with some 113,000 voters still on the state’s rolls but untethered to a physical mailing address according to their registration records, the possibility of election mischief within this mystery population is still cause for concern.
That’s particularly true in counties with high percentages of inactive voters. As I found after a review of all 105 Kansas county voter rolls, the wide variance in proportions of those unconfirmed, but still legal voters, illuminates more questions than answers about individual county efforts to clean up those rolls.
Election offices mark voters as “inactive” when US mail cannot be delivered or is returned.
Most “inactive” voters have unknown or invalid addresses from the perspective of the election office, but can still vote without any checks and balances to verify address, or to verify they are voting the correct ballot.
Shouldn’t all inactive voters be forced to vote provisionally to verify their address? That’s not required now.
When voter rolls are not actively maintained, inactive voters can linger on lists for years. “Bloat” in voter lists is a concern for those with a security mindset since it has the potential to be a source of voter fraud.
Overall, the current 5.6% inactive rate in Kansas is very good, especially when compared with other states. Wisconsin had a staggering 54% inactive rate in May 2024.
Sadly, many voter list maintenance improvements are blocked without changes to federal law.
Voter list maintenance
There is little or no uniformity among the 105 Kansas county clerks and election commissioners in how or when voter list maintenance is performed. Much like states act independently of the federal government in many election matters, counties act independently of the state.
Adding and removing “inactive” voters should be a continuous process for county election officials. An inactive rate that is too high, or too low, might indicate poor list maintenance.
If more voters are marked “inactive” over time than are removed, the inactive percentage can grow if purges are rarely performed. A high inactive rate for a county can reflect poor list maintenance.
Likewise, if new inactive voters are never tagged in a voter list, a low inactive percentage might also reflect poor list maintenance. Or possibly, near zero numbers are indictive of near perfect list maintenance.
County elections officials should be asked about their process when inactive rates are very high or very low.
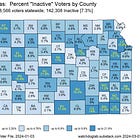
Statewide “Inactive” Map
The rate of inactive voters by county was measured using a voter file from the Secretary of State on Jan. 2, 2025. The map below shows the wide variation in inactive voter rates across the state.
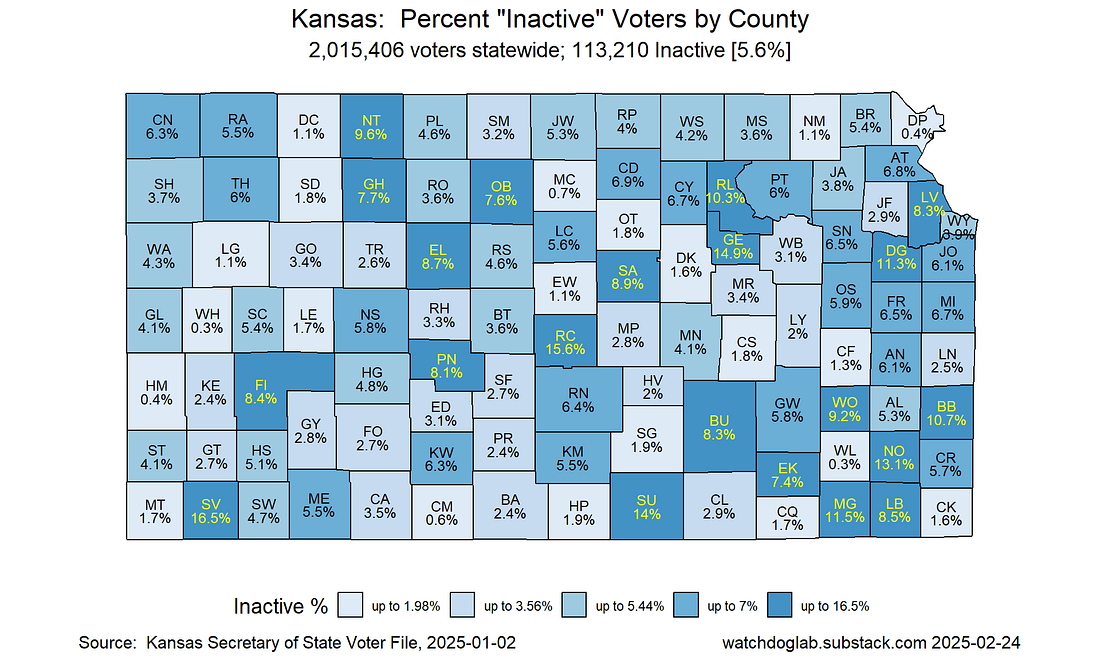
Breaking inactive rates into five quintiles is a good approach — this breaks the counties into five sets based on their inactive rates: Lowest, Low, Middle, High, Highest.
The Lowest and Highest sets deserve scrutiny.
Counties with very high and very low rates
Highest inactive rates (greater than 10%)
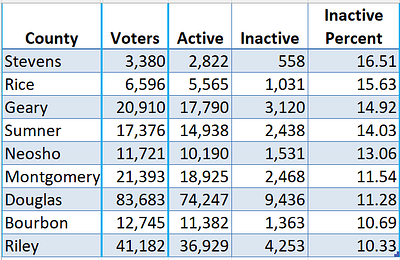
Are these high rates because list maintenance has not promptly removed “inactive” voters eligible to be purged by law?
Or are some inactive rates very high now because of recent extra work to catch up on processing of inactive voters, such as those missing the last two November general elections?
Lowest inactive rates (less than 2%)
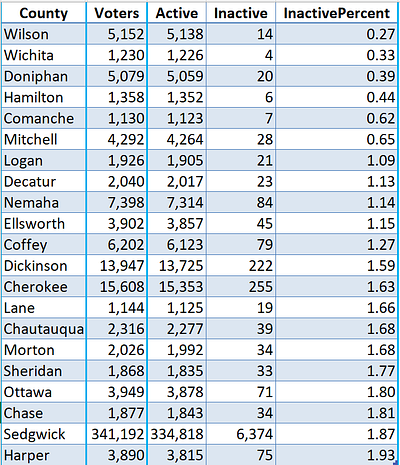
Are these low rates because list maintenance has not promptly added “inactive” voters for various reasons?
Or are some rates very low because counties purged “inactive” voters after the Nov. 2024 general election once legally eligible to be purged?
Time Series
In Kansas statewide voter files are expensive ($200) to acquire for data analysis. [Voter files in some states are free or very low cost. Why not Kansas?]
How can we use free or low cost data to evaluate whether list maintenance is actively ongoing over time?
A new Kansas law passed in 2021 requires the Secretary of State to publish certain statistics online every month by county about “inactive” voters:
This monthly data since July 2021 can be found online: Kansas Secretary of State “Inactive” Data: Election Statistics Data, Voter Registration, Monthly County Totals.
This data would be more valuable for research purposes if it were ALL online. My review of the link above shows 29 months of “inactive” data files are missing at present!
The current online data provides information from six dates in 2021, two dates in 2022, two dates in 2023, five dates in 2024, and two dates in 2025.
Kansas and 105 Counties
These 17 data points in the online data, and 11 additional points from voters files, help tell a story of voter file list maintenance statewide and in each of the 105 counties.
Currently there are 29 data points missing in the statewide “inactive” data, and 29 points missing in each county’s data.
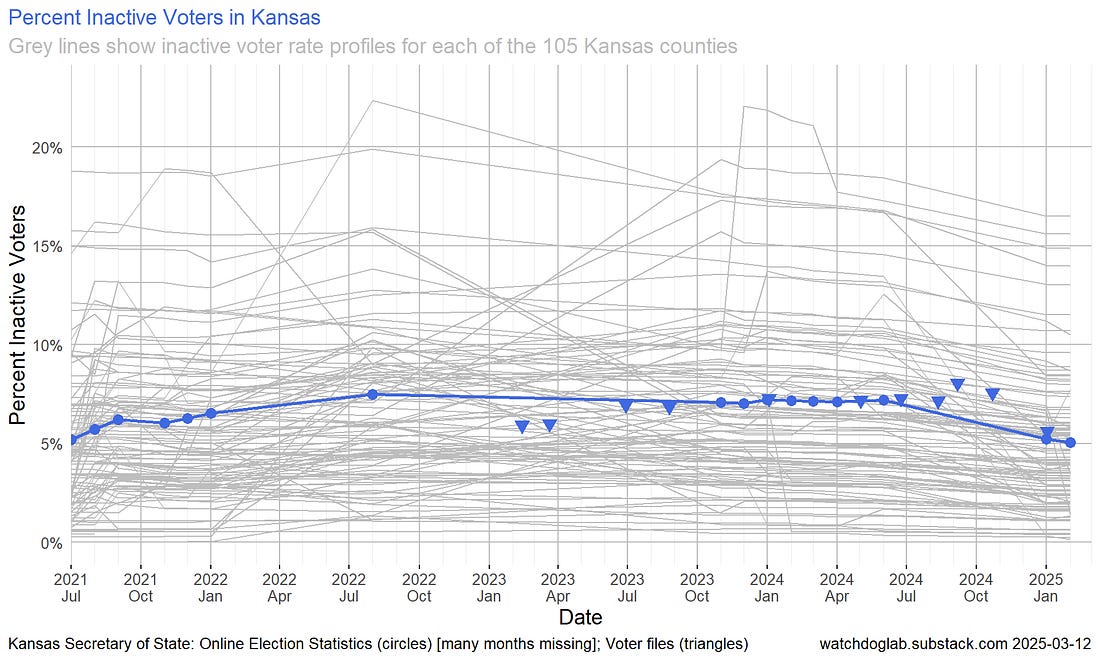
The blue line above shows the overall Kansas inactive rate over time, but the grey lines show the variability in the inactive rates across all 105 counties.
Let’s look at several counties. (See below to find the plots for all counties.)
Selected Counties
Note: scales are the same across all plots below to make comparisons a bit easier.
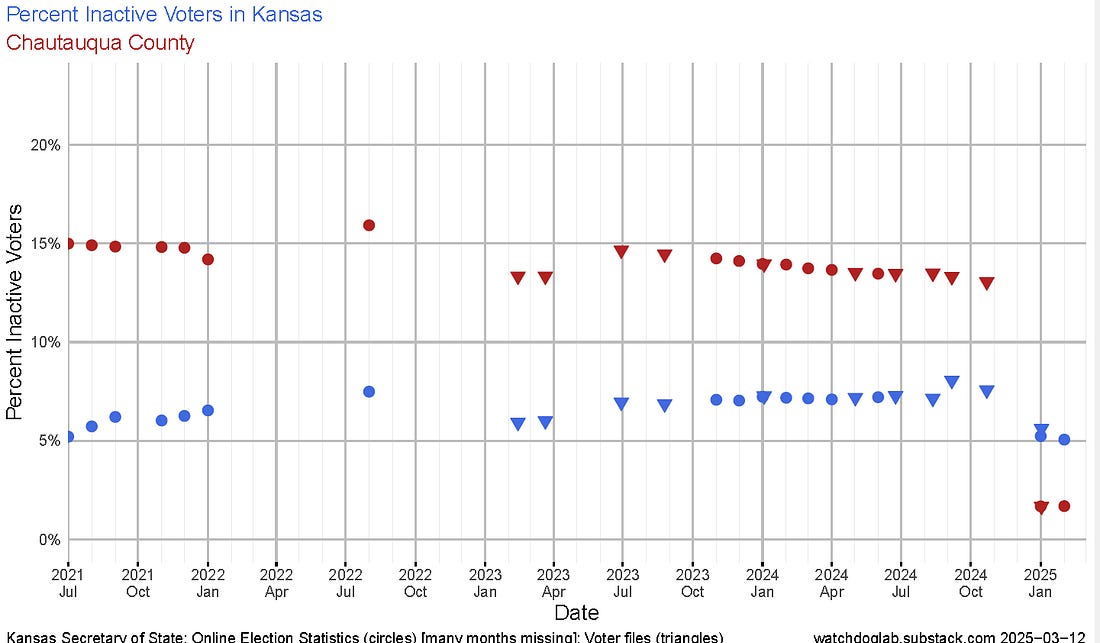
Chautauqua County
After several years of having one of the highest inactive rates in the state, Chautauqua County starts 2025 with one of the lowest rates.
Chautauqua should be commended for its huge improvement!
Sherman County showed a similar large improvement for 2025.
Geary County showed a somewhat similar very high inactive rate for past years, but still has a very high rate with little improvement.
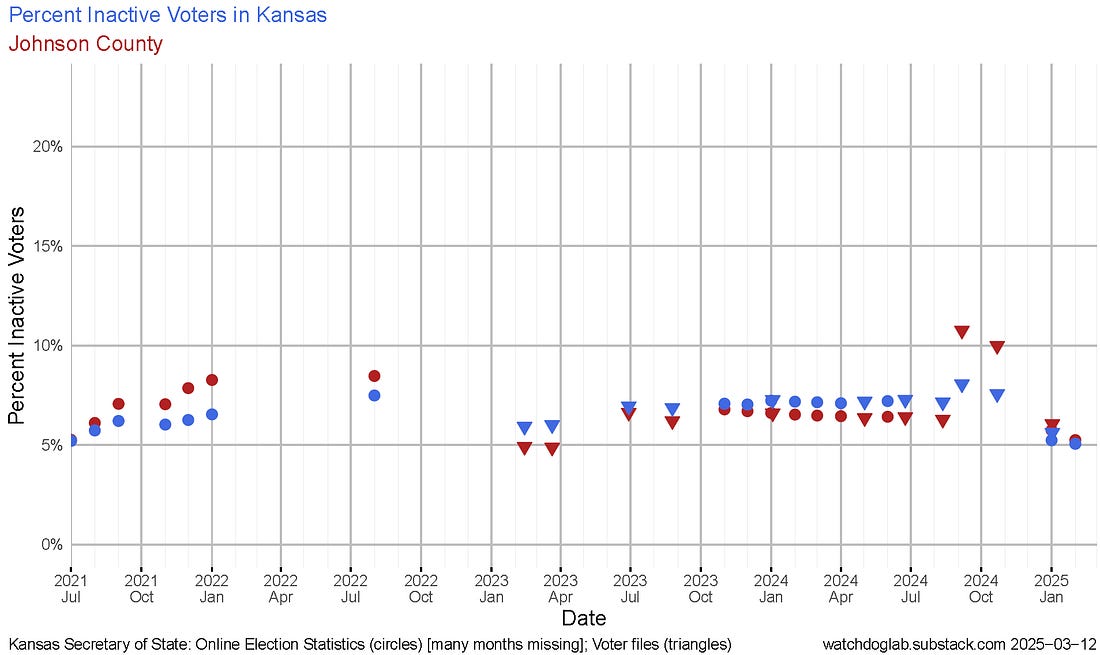
Johnson County
The plot below shows that prior to the Aug. 2022 primary election, Johnson County’s inactive rate was slightly higher than the state rate. After that primary the rate dropped and was lower than the state rate until late 2024.
Voter registration data show the JoCo inactive rate temporarily climbed after the Aug. 2024 primary, but was about the same as the state rate by Feb. 2025.
This plot would be indicative of continuous list maintenance, with prompt actions after the primary and general elections.
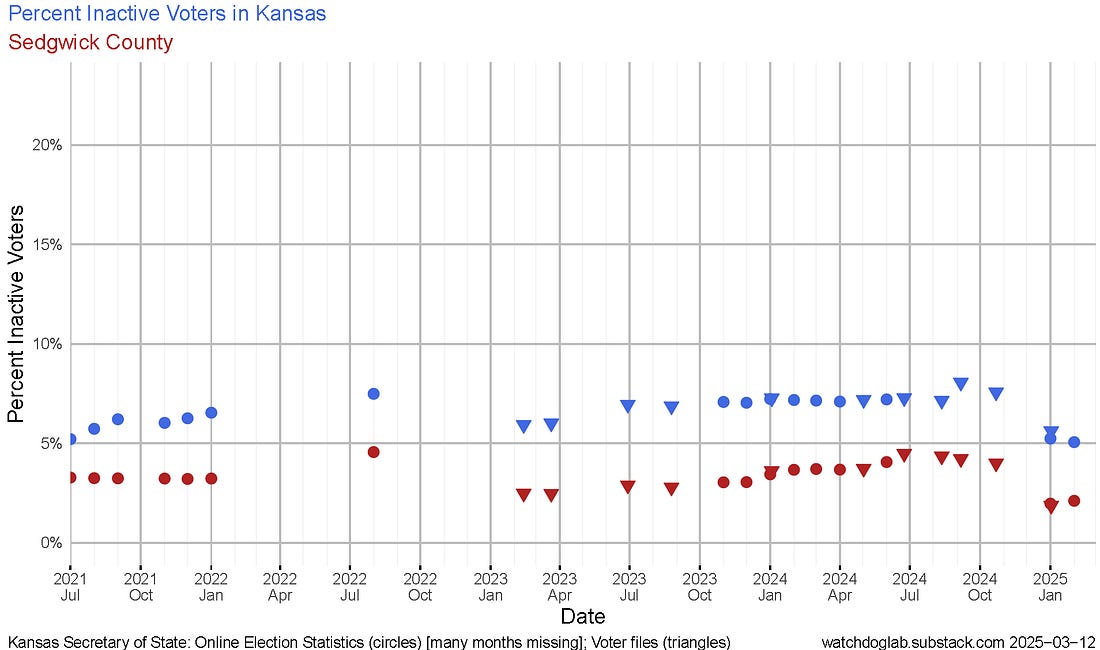
Sedgwick County
The inactive rate for Sedgwick County is about 2 to 4 percentage points below the statewide numbers. What is their secret?
There is no concern about the 1.87% inactive rate for Sedgwick County shown in the table above of counties with less than a 2% rate.
Sedgewick County is a model for all counties in keeping a low inactive rate over the last few years.
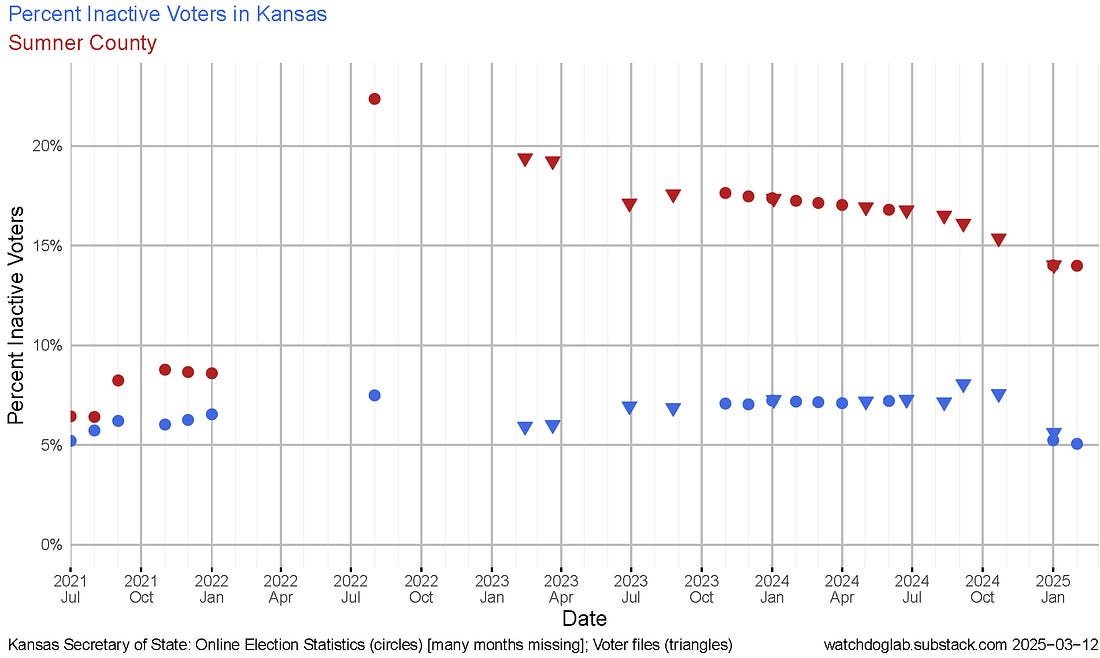
Sumner County
Some of the missing inactive data on the Secretary of State’s website might help pin down when something changed in Sumner County.
Before Jan. 2022 Sumner county had an inactive rate slightly above the state norm, but by Aug. 2022 the rate had skyrocketed to over 22%.
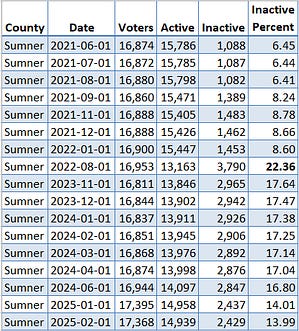
This might be an indication list maintenance had not been occurring on a regular basis and “catch up” pushed the rate very high, which may take several election cycles to clear.
The inactive rate started a slow decline by Nov. 2023, but is still far above the state average.
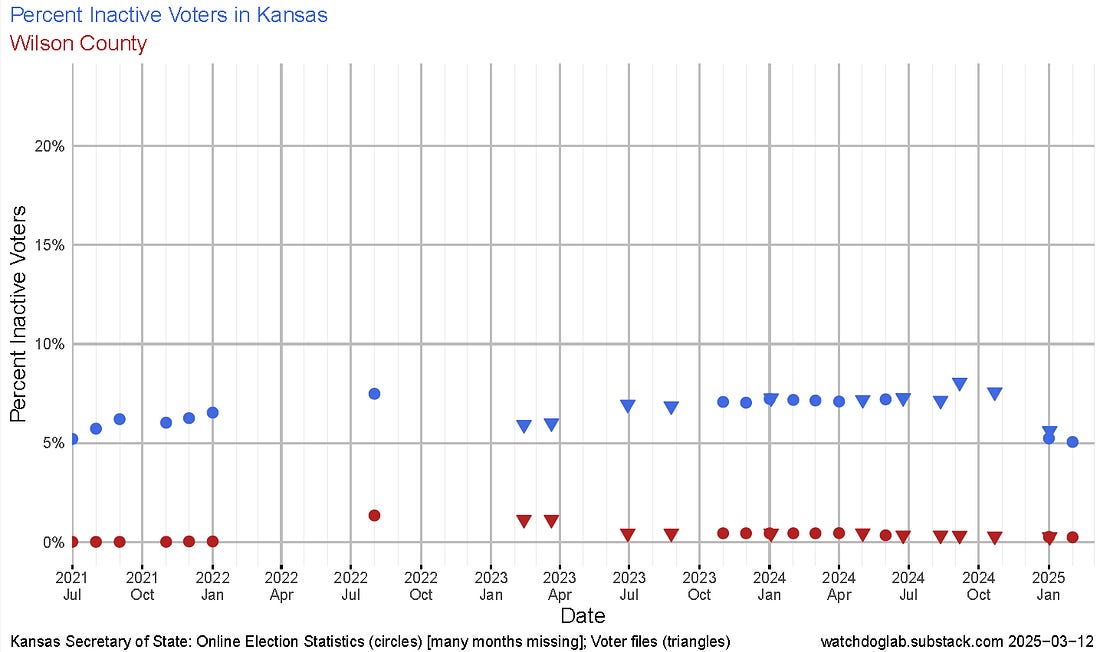
Wilson County
Is Wilson County regularly performing excellent list maintenance, or not doing anything?
Reproducible Research
Related data and an R notebook with all processing details can be found on this GitHub page.
Individual SVG graphics files for each of the 105 counties can be viewed or downloaded from here.
Here’s a PDF of plots like above for all 105 Kansas counties:
| Kansas Inactive Voter Rates By County403KB ∙ PDF file | |
| Plots of inactive voter rates for each of the 105 counties in alphabetical order by name. The final page shows the Kansas statewide plot with lines for all 105 counties shown in grey. | |
| Download | |
Related
“Security Digital Democracy” is a University of Michigan online class that teaches one should approach all aspects of elections and voting with a “security mindset.”
From last year …

Earl Glynn – Watchdog Lab
Earl F. Glynn is a mostly-retired data scientist, scientific programmer, software engineer and physical scientist living in the Kansas City metro area, and the publisher of the substack Watchdog Lab.